tweet

tweet
blog

OverviewMarket sentiment and contrary opinion as measured by various indicators have been used by traders for many years. The theory of contrary opinion asserts that if a majority of traders agrees on the direction of a market move, then the odds are significant that prices will, in fact, move in the opposite direction. Various measures of market sentiment have been used over the years in attempts to apply contrary opinion effectively in the markets. Among these are odd lot short sales, options volatility, broker opinion surveys, and trader opinion surveys. The good news is that the theory of contrary opinion is correct; the bad news is that the traditional measures of contrary opinion either tend to be LATE or generally unreliable. The DAILY SENTIMENT INDEX (DSI) was initiated in 1987 to gather the opinions of traders on all active US futures markets and in the mid 1990's for the Euro zone interest rate and equity futures markets. The primary difference between all other market sentiment indicators and the DSI is that the DSI is available within one hour and that the DSI gathers the opinion of the small retail trader who is most likely to be WRONG at market turning points. By examining small trader sentiment we can arrive at a very valid measure of contrary opinion that has had an uncanny record of accuracy for many years. Yet, we also know that in spite of the fact that small traders are usually the most bullish at the top and the most bearish at the bottom, the real issue is HOW TO TIME market entry using the DSI. As always, timing is the ultimate issue. This report will give youan overview of DSI and timing with DSI. In the charts below DSI is shown as percentage of traders bullish. Here is what the daily DSI report looks like. the cells show the % of small traders bullish on the market. The four (4) columns show raw DSI and 3, 5, 9, and 18 day moving averages of the raw DSI. The sample shown below illustrates a typical daily report.
Daily Sentiment Index at Extremes: Typical BehaviorIn gathering over 18 years of daily sentiment a number of clear patterns have emerged. They are as follows: • When the DSI rises to the 85% area or higher the odds of a top are significant • When the DSI falls to the 15% area or lower, the odds of a bottom are significant • The longer the DSI remains at a high level, the larger and longer the coming decline is likely to be • The longer the DSI remains at a low level, the larger and longer the coming rally is likely to be • The small trader is NOT always wrong at turning points they are USUALLY wrong at EXTREMES • The DSI can be used as a timing indicator on its own • The DSI can be used as a timing indicator when combined with other indicators and as part of an overall trading model. HERE ARE SOME CHARTS ILLUSTRATING THE DSI AT MARKET EXTREMES: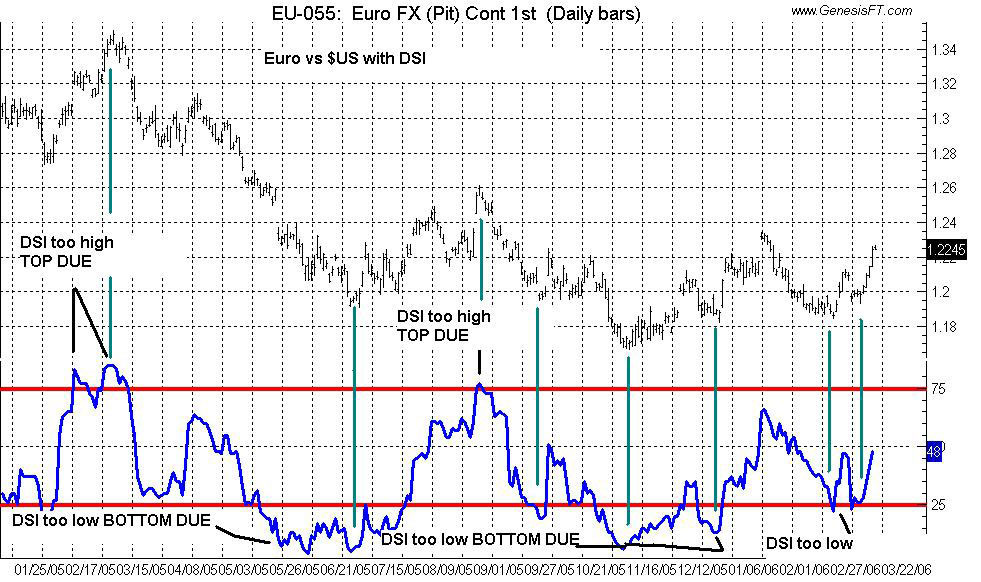 This chart shows the DSI plotted against the Euro. I have marked areas where the DSI was at an extreme high or low. Note the close correlation between DSI tops and bottoms and price tops and bottoms. Note also that DSI is a LEADING indicator - it tends to precede price tops and bottoms. Furthermore, DSI can be combined with traditional indicators as a confirming tool. 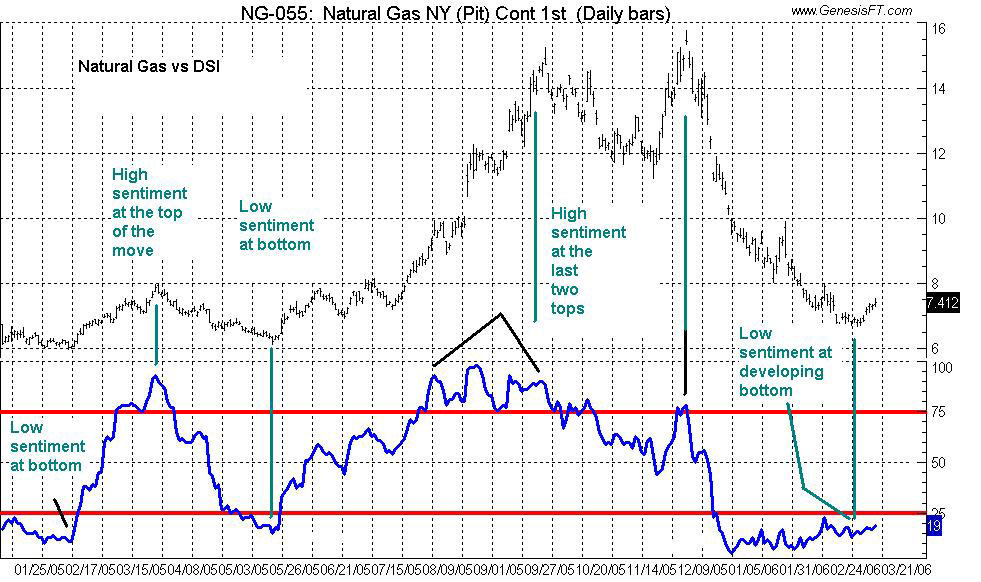 This chart shows Natural Gas futures plotted against daily DSI. As you can see, the highs and lows in DSI at EXTREMES correlate closely with tops and bottoms in price. Here also note that the DSI tends to precede tops and bottoms and it is, therefore, an effective leading indicator. 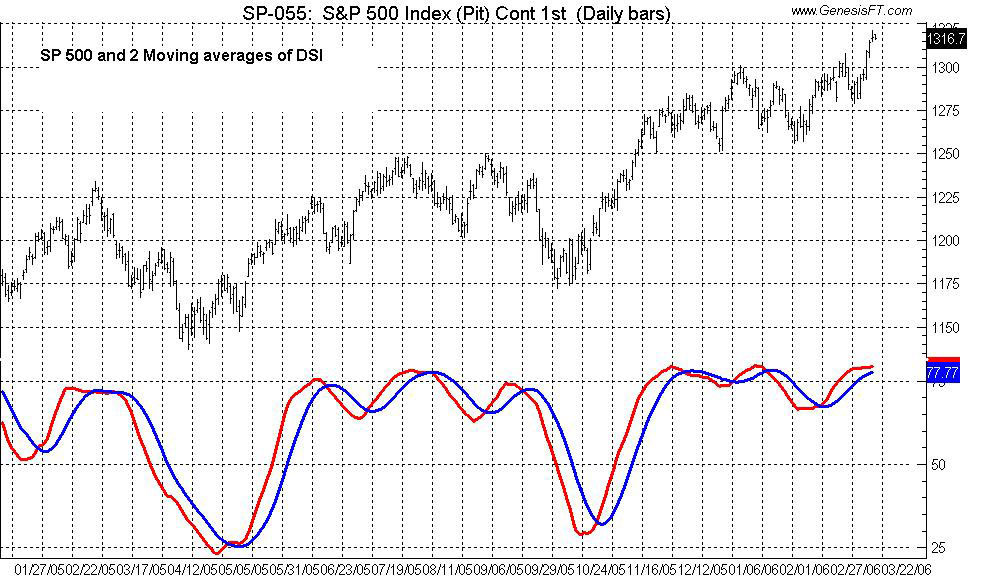 This chart shows an entirely different application if DSI. I've run a moving average of the DSI (red line) with a moving average of the moving average (blue line). Short term buy and sell signals are indicated when the lines cross. By adding trailing stops and effective risk management, the DSI can be used more systematically as its own confirming indicator. 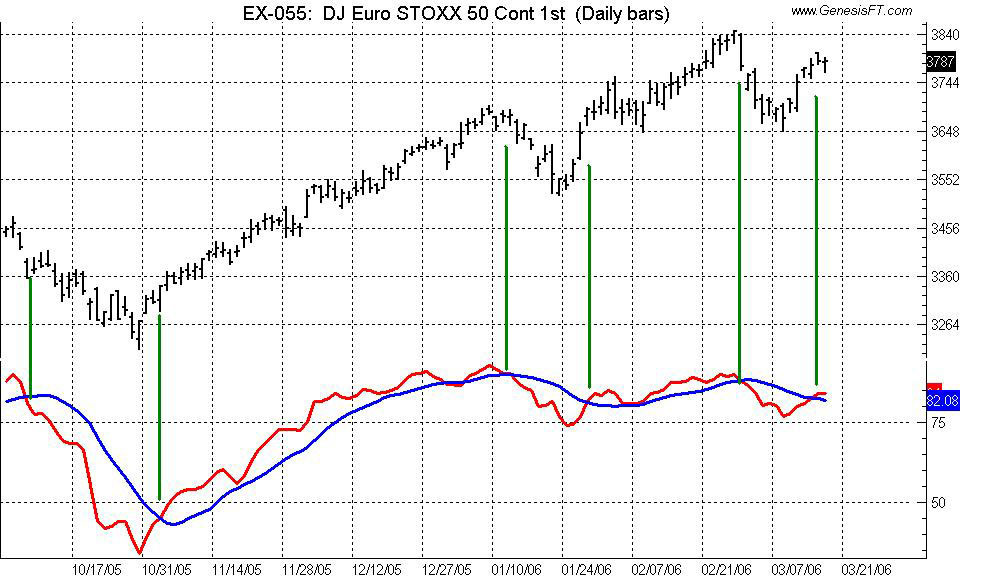 This chart shows the EuroStoxx 50 vs two moving averages of DSI. Signals occur at the moving average crossovers. Timing Indicators and DSIIn addition to the applications above, DSI can be used in conjunction with technical indicators such as momentum, stochastic's, ADX, RSI and moving averages either as a confirming indicator, but more often as a leading indicator of possible trend changes. Who Uses the DSI?The DSI and DSI Europe are used by some of the most well know institutional investors, money managers, banks and brokerage firms as well as individual traders the world over. Subscribers to the DSI service read like a "who's who" of major players in the markets. Suggested Applications of DSIWithin the context of a trading model that includes a SETUP, TRIGGER and FOLLOW THROUGH procedure the DSI is a SETUP. In our experience its best application is as part of an overall timing approach that includes other indicators as well as a trigger for position entry. DSI can remain at a high or low level for many days and in this way it is similar to various other "overbought" or "oversold" indicators. DSI clients have developed a variety of proprietary applications for DSI. SummaryThe Daily Sentiment Index has shown itself to be a valid indicator of short term market swings. Since DSI is not derived from price it is distinctly different than the vast majority of indicators currently being used by traders. DSI provides an "emotional" indicator of market behavior which, given that it is not directly related to price, places it in a unique position in the broad spectrum market related data. There are numerous other uses above and beyond those described in this brief report. DSI clients currently include some of the top money managers, traders, financial institutions and speculators throughout the world. DSI data is available within one hour of market closings. It is supplied as a report, data file or recorded message. It can be delivered by FAX, data download (FTP) and/or Internet. The entire historical data base (from 1987 to present in US markets) is available for research purposes and accompanies all subscriptions. |
|||||||||||||||||||||||||||||||||||||||||||||||||||||||||||||||||||||||||||||||||||||||||||||||||||||||||||||||||||||||||||||||||||||||||||||||||||||||||||||||||||||||||||||||||||||||||||||||||||||||||||||||||||||||||||||||||||||||||||||||||||||||||||||||||||||||||||||||||||||||||||||||||||||||||||||||||||||||||||||||||||||||||||||||||||||||||||||||||||||||||||||||||||||||||||||||||||||||||||||||||||||||||||||||||||||||||||||||||||||||||||||||||||||||||||||||||||||||||||||||||||||||||||||||||||||||||||||||||||||||||||||||||||||||||||||||||||||||||||||||||||||||||||||||||||||||||||||||||||||||||||||||||||||||||||||||||||||||||||||||||||||||||||||||||||||||||||||||||||||||||||||||||||||||||||||||||||||||||||||||||||||||||||||||||||||||||||||||||||||||||||||||||||||||||||||||||||||||||||||||||||||||||||||||||||||||||||||||||||||||||||||||||||||||||||||||||||||||||||||||||||||||||||||||||||||||||||||||||||||||||||||||||||||||||||||||||||||||||||||||||||||||||||||||||||||||||||||||||||||||